
Selected open source libraries for beautiful charts, graphs and data visualization in your JS applications
We live in an era of data-driven decision making. Often times looking at raw data is unappealing and boring, that’s where data visualization helps. Here are some handpicked open source javascript libraries that I would recommend you use for your next project.
D3js
At 80k stars D3.js is probably the most popular and extensive Javascript data visualization library out there. D3 is built for manipulating documents based on data and bring data to life using HTML, SVG, and CSS. D3’s emphasis on web standards gives you the capabilities of modern browsers without coupling to a proprietary framework, combining visualization components and a data-driven approach to DOM manipulation. It allows you to bind arbitrary data to a Document Object Model (DOM), and then apply data-driven transformations to the document. Here’s a great example gallery.
Metric-Graphics
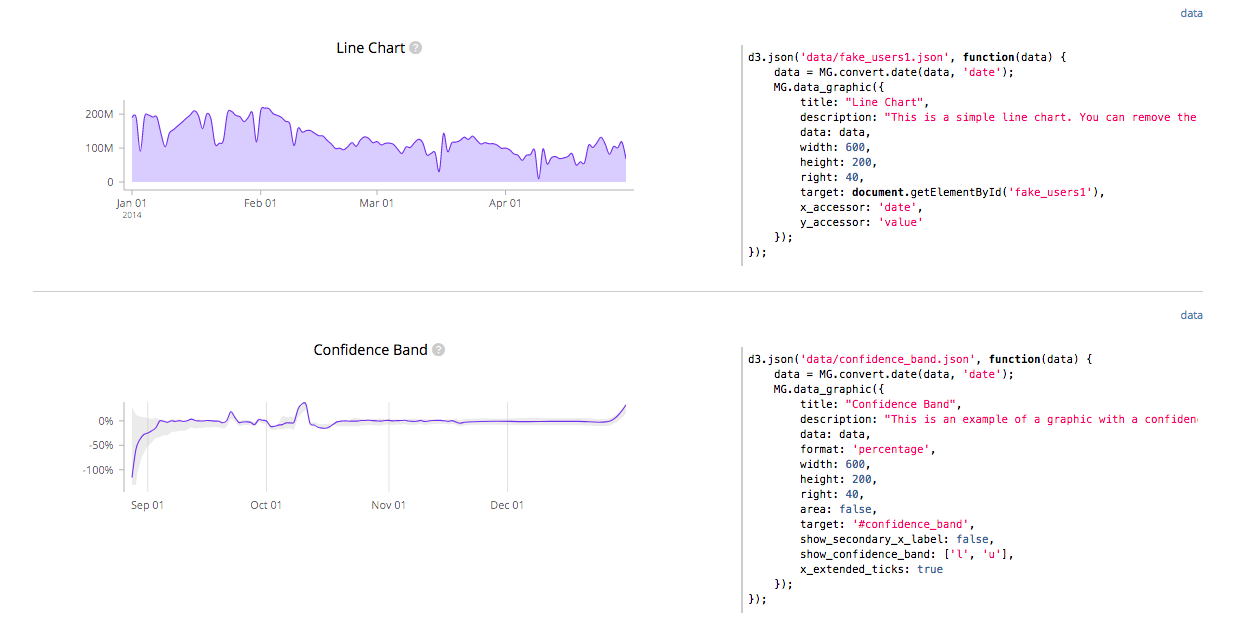
MetricsGraphics.js (7k stars) is a library optimized for visualizing and laying out time-series data. It’s relatively small (80kb minified), and provides a narrow yet elegant selection of line charts, scatterplots, histograms, bar charts and data tables, as well as features like rug plots and basic linear regression. Here’s a link to an interactive example gallery.
C3js
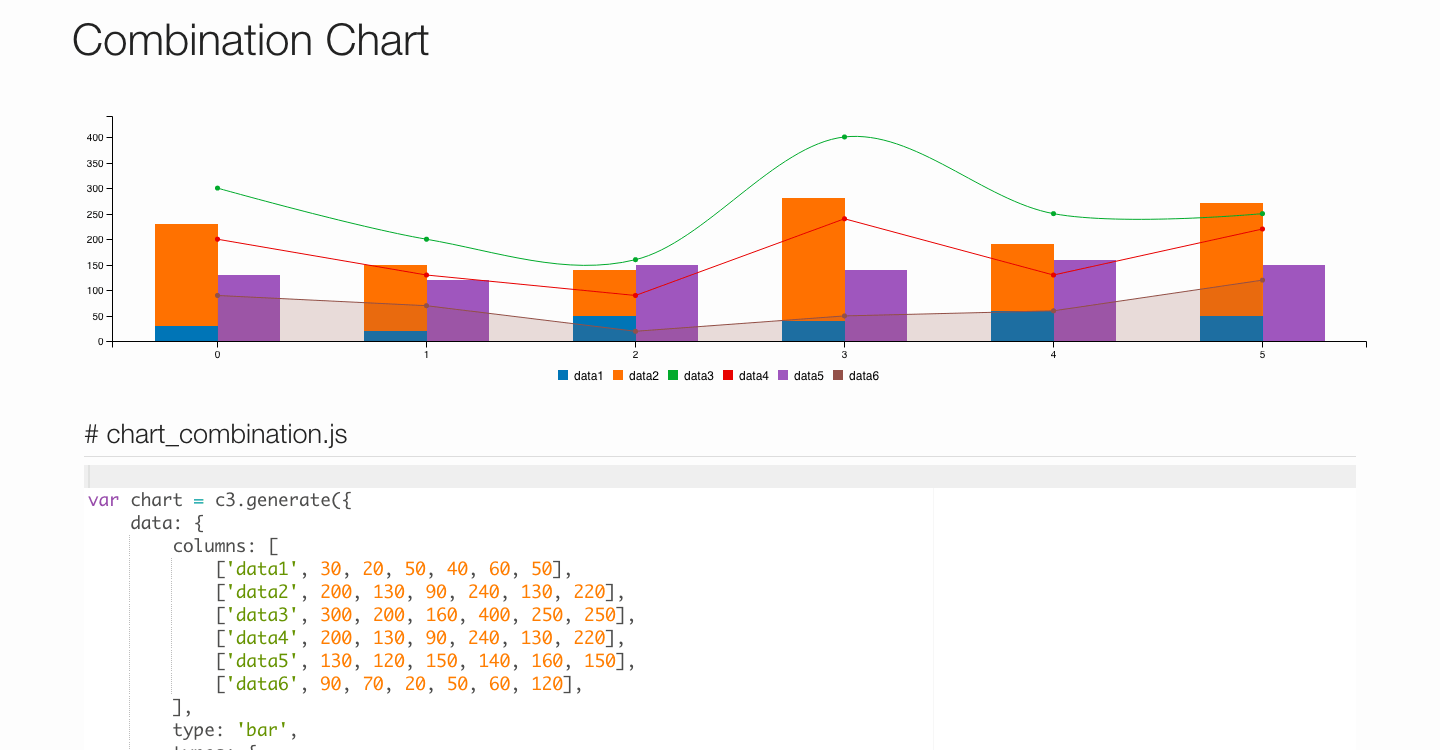
At 8k stars C3 is a D3-based reusable chart library for web applications. The library provides classes to every element so you can define a custom style by the class and extend the structure directly by D3. It also provides a variety of APIs and callbacks to access the state of the chart. By using them, you can update the chart even after it’s rendered. Take a look at these examples.